Brightstar Blog
Welcome to our free blog! Here, you can receive exclusive access to informative articles, media presentations, and other forms of educational help for traders. Log in at the top of the site, or register to become a free member when you click on a More with Free Membership link below. Other links provide access to content for non-registered users.
Market Moment
How to Play an IPO NEW
by BradS
Initial Public Offerings (IPOs), such as the one provided on June 12 by Elon Musk’s company, SpaceX, have long fascinated traders. The excitement surrounding a company’s first day of public trading often generates substantial price movement, creating opportunities that can be difficult to find elsewhere. Yet, IPOs are also among the most misunderstood trading vehicles in the financial markets. Many traders are drawn to the headlines and publicity while overlooking the unique risks that accompany newly issued shares.
Although every IPO is somewhat different, the following steps can help traders approach new stocks with greater discipline and effectiveness.
General Interest
Why Aren’t Loans Cheaper? UPDATED
by BradS
When the Federal Reserve cuts interest rates, many people assume borrowing money will immediately become cheaper. It seems logical—if the Fed lowers rates, banks should follow suit, right? Not exactly. While the Federal Reserve plays a significant role in shaping the cost of borrowing, the connection between its decisions and your loan or credit card rate is not as direct as it sounds.
To understand why a Fed rate cut doesn’t necessarily translate into lower loan rates for consumers, we need to examine how banks obtain money, what the Fed actually controls, how its balance sheet influences interest rates, and why banks sometimes choose not to pass lower funding costs on to borrowers.
Market Talk Isn’t a Trading Strategy
by BradS
Turn on any business channel during market hours and you will see the same choreography play out again and again: confident voices, scrolling tickers, urgent headlines, and instant explanations for whatever just happened. Stocks rise on confidence. Stocks fall on fear. Interest rates matter—until something else suddenly matters more. The delivery is smooth, the tone authoritative, and the certainty comforting. Yet, for traders who actually have capital at risk, an uncomfortable truth slowly emerges: most of what sounds useful is not actually tradable.
The fog lifts once you realize that the people speaking fall into three very different roles—commentators, portfolio managers, and market technicians—even though television flattens them into a single category of “experts.” Understanding this distinction is not academic. It is one of the most practical skills that a trader can develop.
Owning the Move and Not the Metal
by BradS
All of us have seen commercials where a confident voice urges us to buy gold or silver. The pitch is always the same: protect your wealth, secure your future, and safeguard your family from economic collapse. The imagery provided is powerful—stacks of shining coins, bars of precious metal, and smiling families at ease because they own something “real.” It’s easy to see why many people fall for these advertisements. They appeal to our fear of inflation, distrust in government, and desire for security in uncertain times.
But once you step back from the emotional appeal, the picture looks very different. Gold and silver bullion—those shiny coins and bars you can hold in your hand—are not the safe, smart, or efficient investment that commercials make them out to be. In fact, putting hard-earned money into bullion often comes with hidden downsides that rarely get discussed.
Lessons from Company Ownership
When James Lewis Kraft began selling cheese from a Chicago horse-drawn wagon in 1903, few could have predicted that he was laying the foundation for one of the world’s most enduring food empires. By the 1920s, Kraft had built a household name from his innovative application of pasteurization to cheese. In 1928, the company went public, a move that raised capital for expansion, but diluted the Kraft family’s ownership. When J. L. Kraft died in 1953, his only daughter Edith inherited personal wealth, but no real control of the company. By then, Kraft was run by professionals and company ownership was spread across thousands of shareholders. The family name lived on, but the family itself was out of the picture.
A Texas-Size Tale Worth Telling
Everyone likes a good story, and the financial markets have some unusual ones. Few are more dramatic than the saga of the Hunt brothers—two Texas oil heirs who tried, and spectacularly failed, to corner the silver market in the late 1970s. Their tale contains all of the juicy elements that you might expect: family fortune, global intrigue, government intervention, and a crash that shook Wall Street. What began as a hedge against inflation spiraled into one of the most infamous and speculative manias of the 20th century. At its peak, silver’s meteoric rise seemed almost unstoppable, and the brothers appeared to be masters of a market they understood better than anyone. Yet, as prices climbed, the line between speculation and manipulation grew increasingly blurred.
Understanding Settlement
Behind the excitement of trading screens and fast-moving prices is settlement—one of the most critical activities that occurs in the financial markets. Every trade, whether it is the purchase or sale of shares, or a futures contract, must eventually be “settled” because it is the process that transforms an executed trade into an exchange of value between buyer and seller.
Although the term applies to both stocks and futures, the mechanics, timing, and risk controls involved are very different. Here, I explore the details of settlement, the role of clearinghouses, and the effects of default.
What Really Moves Prices?
Recently, I spoke with an elderly man who expressed frustration that his investments were losing value. To him, the markets seemed to drop without warning or logic. He firmly believed that day traders—those who buy and sell securities within the same day—were responsible for pushing the market lower and causing his losses. While understandable, this belief overlooks the complex forces that truly move market prices.
Trading: A Superior Form of Self-Employment
Day Trading
Why I Day Trade the E-mini Dow
Among those who day trade stock index futures, the E-mini Dow futures market is one of the best kept secrets on Wall Street. Many E-mini participants trade the S&P 500 (ES), Nasdaq-100 (NQ) or Russell 2000 (RTY). For various reasons, these markets are not as easy to trade. ES is mostly controlled by institutions which gives it a jerky institutional flavor in moving from one price level to another. Continued…
How Long Does it Take to Learn?
Traders may be classified as professionals or nonprofessionals. The first group is largely comprised of individuals who trade for financial firms, manage other people’s portfolios, and otherwise make their living from trading. Employers often train their own people and impose their own rules on performance. For these reasons and others, I usually prefer to work with nonprofessionals. Continued…
Making Sense of Net Change in Day Trading
Data providers routinely include “net change” among their price quotations. Net change is based upon the difference between a closing price from the previous day and the current market price. In futures trading, the closing price is not as obvious as one might expect because it can appear in two forms: last price or settlement price.
The last price is the price at which the market traded when it closed on the previous day. It is a straightforward quote and appears on intraday charts. The settlement price is more complicated. This price is the fair market value of the contract traded as determined by a number of factors selected by the exchange. It is displayed as the official price for the end of the day and appears on daily and higher time-frame charts, but not intraday charts.
Because the last price and settlement price are often different from one another, the net change values based upon these prices are also different. As a day trader of E-mini Dow futures, you may notice a difference between the net change provided as a quote and the distance between yesterday’s closing price and the current market price on your intraday charts. When that happens, your data provider is likely using the settlement price in calculating net change rather than the last price.
Swing Trading
Profiting from the Professionals
by BradS
“If you understand how portfolio managers (PMs) think, you can make money on that.” This is something that I tell my clients regularly.
Professional PMs often portray themselves as independent thinkers who allocate capital in unique ways. In reality, most PMs think and act in a similar manner. This is not a failure of intelligence or creativity, but the predictable outcome of a highly standardized educational and professional system. Most PMs are trained in like-minded finance and economics programs, and reinforced by the Chartered Financial Analyst (CFA) curriculum, a sell-side research culture, and years of exposure to the same macro frameworks and prevailing interpretations. The result is a shared worldview that contains common assumptions about markets, definitions of risk, and ways of interpreting information. For technical traders, this “sameness” creates predictable patterns of behavior that offer opportunities for making money.
A Gem of a Pattern
Above the Stomach is a powerful candlestick pattern that forecasts upward price movement and often provides a wonderful opportunity to make money in 1-3 days.
Below, we provide two examples of trade opportunities that were profitable based upon instruction in our eLearning course, Above the Stomach Candlestick Trading.
Each upper chart shows the parameters of a trade when a position is established. Each lower chart displays the progress of the trade until its conclusion.
EXAMPLE #1
Royal Gold, Inc. (RGLD)
TRADE PARAMETERS
Position Size: 100 shares
Entry: 173.32 (black line) Thurs, Nov. 6, 2025
Initial Stop: 168.88 (red line)
Target: 193.08 (green line) Tues, Nov. 11, 2025
RESULTS
With a 100-share position, gross profit was $1,976.00 (193.08 – 173.32 x 100) in 4 days of trading.

Charts courtesy of StockCharts.com
EXAMPLE #2
Southern Copper Corp. (SCCO)
TRADE PARAMETERS
Position Size: 100 shares
Entry: 134.71 (black line) Thurs, Nov. 6, 2025
Initial Stop: 130.62 (red line)
Target: 139.25 (green line) Mon, Nov. 10, 2025
RESULTS
With a 100-share position, gross profit was $454.00 (139.25-134.71 x 100) in 3 days of trading.

Charts courtesy of StockCharts.com
Position Trading

Market Differences:
Dow vs. S&P
Stock market movement is often summarized through indices that track groups of companies. The two most popular indices are the Dow Jones Industrial Average (DJIA) and the S&P 500 Index. Each represents a different way of measuring market movement which can shape our view of the U.S. economy and its companies.
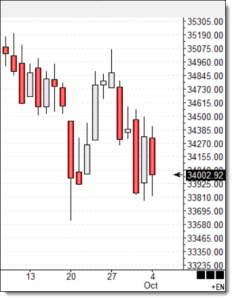
Determining Market Breadth with the New High-New Low Index
A physician may check blood pressure, pulse, respiration rate, and body temperature to assess the general health of a patient. In the same way, traders can examine internal aspects of the stock markets to determine whether long-term market direction is strong and healthy.
Market internals tell us whether the average stock is performing the same way as a major market index. They also tell us if index direction is simply the result of large moves made by a handful of stocks. Several measures of internal market strength (breadth) are available to traders. On the daily chart that follows, we look at a popular measure known as the New High-New Low Index ($USHL) and apply it to activity in the S&P 500 Index ($SPX).
Recommended Resources
Computer Equipment for Traders
In the world of trading, reliable computer equipment is critical for success. Ever-changing market conditions and rapid price movement require traders to have powerful systems that keep up with the demands of real-time data analysis and provide a competitive edge in the markets.
At Brightstar Training, LLC, we are sometimes asked for recommendations related to computers, accessories, and peripherals. As a result, I have written a special article for traders who want to move beyond outdated technology, dive into details, and stay ahead of the game. Continued…
Ensign Charting Software
 Ensign charting software contains many useful features that are difficult to find in other charting applications. The price for leasing the software is attractive. Rather than increasing prices every year, Ensign maintains a reasonable and stable price structure while offering a high-quality product.
Stock Trader’s Almanac 2026
 For many years, Stock Trader’s Almanac (STA) has endeavored to provide “the necessary tools and data to invest and trade successfully (Hirsch & Mistal, 2026, p. 7).” It was originally created by Yale Hirsch (1923-1921) and reflects his lifelong interest in market history, cycles, and price patterns. His son, Jeffrey, joined Hirsch Holdings, Inc. in 1990 and eventually became editor-in-chief with a desire to improve the content and application of the almanac. Continued…
Reminiscences of a Stock Operator
by Edwin Lefèvre (annotations by Jon D. Markman)
 This book is a favorite among traders. It recounts the life and times of renowned speculator Jesse Livermore (1877-1940). Told in the first person by a fictional character named Larry Livingston, the story describes one trader’s rise from amateur to professional. Though written as a historical novel, the vast majority of people and events in the book are real. In addition, annotator Jon D. Markman includes photos, information, and commentary that create a useful context for understanding Livermore’s journey.
Perhaps the most interesting aspect of the book is that it shows how Livermore evolved as a trader through careful observation of markets and detailed evaluation of his trading behavior. While participating in both stock and commodity markets, he developed a stable set of trading procedures that shaped his career and may be employed in modern markets. Continued…
StockCharts.com
![]() StockCharts.com offers numerous features designed to assist market participants with making sound decisions. It combines technical tools and educational information in a massive website. Charts and stock scanners are particularly useful for active traders. They enable easy identification and analysis of trades. The user may develop code for scans and use it to locate trades based upon personal preference. Several free features are available. Many more desirable features are provided for a modest fee.
StockCharts.com offers numerous features designed to assist market participants with making sound decisions. It combines technical tools and educational information in a massive website. Charts and stock scanners are particularly useful for active traders. They enable easy identification and analysis of trades. The user may develop code for scans and use it to locate trades based upon personal preference. Several free features are available. Many more desirable features are provided for a modest fee.
Biography
The New Era of the Booming 1920s and Its Aftermath
The Biography of Visionary Financial Writer Richard W. Schabacker
by George A. Schade, Jr.
 In this day and age, history is often viewed as a collection of facts and figures rather than what it really is — a rearview look at real people who struggled to make sense of their times and offer contributions to the world.
George Schade’s journey through the brief but meaningful life of Richard W. Schabacker (1899-1935) offers readers a rare look at the evolution of financial markets in the early part of the twentieth century. During his employment at Forbes magazine in the 1925-1935 period, Schabacker became financial editor and wrote numerous articles intended to educate subscribers. As Schade points out, Schabacker’s keen insights and obvious writing ability enabled him to spread the word about the importance of technical trading.
A lesser-known fact about Schabacker is that he published a correspondence course in 1932 that covered chart formations and trading tactics. After his death, brother-in-law Robert Edwards collaborated with Albert Kimball to present much of the course in book form. This 1937 text later served as the basis for Part I of Technical Analysis of Stock Trends published by Edwards and McGee in 1948. Today, Edwards and McGee is widely regarded as the early Bible of technical analysis. Historically, though, it is clear that a large portion of this Bible came from Schabacker.
Schade’s book is detailed and well-researched. It is a must read for market participants who desire to trace the roots of technical analysis and trading.